Doubly Scalable with Raku
[184] Published 22. May 2022.This is my response to the Perl Weekly Challenge #165.
Challenge #165.1: Scalable Vector Graphics (SVG)
For this task, you may use external library, such as Perl’s SVG library, maintained in recent years by our very own Mohammad S Anwar. You can instead generate the XML yourself; it’s actually quite simple. The source for the example image for Task #2 might be instructive.
Your task is to accept a series of points and lines in the following format, one per line, in arbitrary order:
Point: x,y
Line: x1,y1,x2,y2
Example 1:
53,10
53,10,23,30
23,30
I have chosen to generate the svg by hand (or rather, by code). I have used the source code of the svg file from the second task as template (as hinted at in the challenge).
File: mksvg1
#! /usr/bin/env raku

unit sub MAIN ($file where $file.IO.f && $file.IO.r);      # [1]

my @lines;                                                 # [2]
my @points;                                                # [3]
my $height = 0;                                            # [4]
my $width  = 0;                                            # [4a]

for $file.IO.lines -> $row                                 # [1a]
{
  my (@elems) = $row.split(",");                           # [5]

  if (@elems.elems == 4)                                   # [6]
  {
    @lines.push: @elems;                                   # [6a]

    $height = max($height, @elems[1], @elems[3].Numeric);  # [6b]
    $width  = max($width,  @elems[0], @elems[2].Numeric);  # [6b]
  }
  elsif (@elems.elems == 2)                                # [7]
  {
    @points.push: @elems;                                  # [7a]

    $height = max($height, @elems[1].Numeric);             # [7b]
    $width  = max($width,  @elems[0].Numeric);             # [7b]
  }
  else
  {
    die "Wrong number of values; use 2 or 4 only";
  }
}

say '<?xml version="1.0" encoding="UTF-8" standalone="yes"?>     # [8]
<!DOCTYPE svg PUBLIC "-//W3C//DTD SVG 1.0//EN"
  "http://www.w3.org/TR/2001/REC-SVG-20010904/DTD/svg10.dtd">
  <svg height="' ~ $height ~ '" width="' ~ $width ~ '"
  xmlns="http://www.w3.org/2000/svg" xmlns:svg="http://www.w3.org/2000/svg"
  xmlns:xlink="http://www.w3.org/1999/xlink">';

if @lines                                                        # [9]
{
  say '<g id="lines" stroke="#369" stroke-width="4">';           # [9a]

  for @lines -> @line                                            # [9b]
  {
    say ' <line x1="' ~ @line[0] ~ '" x2="' ~ @line[2]           # [9c]
              ~ '" y1="' ~ @line[1] ~ '" y2="' ~ @line[3] ~ '" />'
  }

  say '</g>';                                                    # [9d]
}

if @points                                                       # [10]
{
  say '<g fill="#f73" id="points">';                             # [10a]

  for @points -> @point                                          # [10b]
  {
    say ' <circle cx="' ~ @point[0] ~ '" cy="' ~ @point[1] ~ '" r="3" />';
  }                                                              # [10c]

  say '</g>';                                                    # [10d]
}

say '</svg>';                                                    # [11]
[1] Load the specifivcation from a text file, and iterate over each row [1a].
[2] The lines (as sublist of 4 elements) will end up here.
[3] The points (as sublists of 2 elements) will end up here.
[4] The height and witdth [4a] the illustration (bounding box).
[5] Split each row into separate values, with the comma as separator.
[6] 4 elemens? Then we have a line. Add the coordinates to the list of lines [6a]
and recalculate the bounding box. Note the Numeric coercer, so
that we get numeric comparison. If not, we will get textual comparison, as
split gives us texts (and the result is that «2» would have been
greater than «11»).
[7] 2 elements means a point.
[8] Print the SVG header.
[9] Print the lines, if any. They are grouped inside a «g» tag, as done in the example.
[10] Ditto for the points.
[11] The end SVG tag.
Running it gives the svg printed to the screen, which is useful for debugging:
$ ./mksvg1 example1.txt
<?xml version="1.0" encoding="UTF-8" standalone="yes"?>
<!DOCTYPE svg PUBLIC "-//W3C//DTD SVG 1.0//EN"
  "http://www.w3.org/TR/2001/REC-SVG-20010904/DTD/svg10.dtd">
<svg height="30" width="53" xmlns="http://www.w3.org/2000/svg"
  xmlns:svg="http://www.w3.org/2000/svg"
  xmlns:xlink="http://www.w3.org/1999/xlink">
<g id="lines" stroke="#369" stroke-width="4">
 <line x1="53" x2="23" y1="10" y2="30" />
</g>
<g fill="#f73" id="points">
 <circle cx="53" cy="10" r="3" />
 <circle cx="23" cy="30" r="3" />
</g>
</svg>
Saving it to a file:
$ ./mksvg1 example1.txt > example1.svg
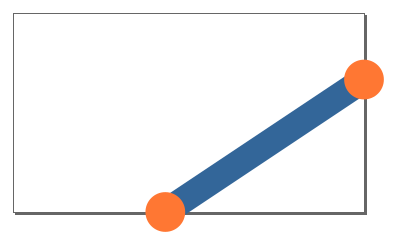
This is a screenshot of the image opened in the vector drawing program Inkscape. Note the bounding box that does not quite fit:
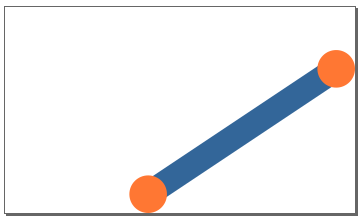
If we add the svg file to a webpage, whatever is outside of the bounding box is not shown:

This is easy to fix, by adding some padding:
File: mksvg2 (changes only)
say '<?xml version="1.0" encoding="UTF-8" standalone="yes"?>
<!DOCTYPE svg PUBLIC "-//W3C//DTD SVG 1.0//EN"
  "http://www.w3.org/TR/2001/REC-SVG-20010904/DTD/svg10.dtd">
  <svg height="' ~ $height +3 ~ '" width="' ~ $width +3 ~ '"
  xmlns="http://www.w3.org/2000/svg" xmlns:svg="http://www.w3.org/2000/svg"
  xmlns:xlink="http://www.w3.org/1999/xlink">';
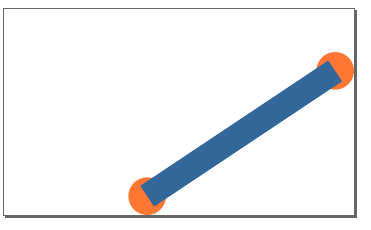
The result, again as a screenshot from Inkscape:
There are two problems with this approach. The first is that it does not handle negative positions (i.e. at the top or left hand side, if we were to put the circle on that side). The second is that we will add this extra size, even if not needed. I'll take a look at that in the bonus section. But first, let us do the second part of the challenge.
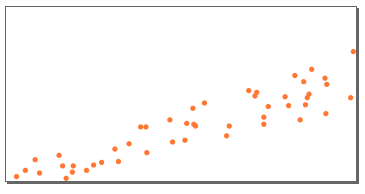
Challenge #165.2: Line of Best Fit

The method most often used is known as the least squares method, as it is straightforward and efficient, but you may use any method that generates the correct result.
Calculate the line of best fit for the following 48 points:
333,129  39,189 140,156 292,134 393,52  160,166 362,122  13,193
341,104 320,113 109,177 203,152 343,100 225,110  23,186 282,102
284,98  205,133 297,114 292,126 339,112 327,79  253,136  61,169
128,176 346,72  316,103 124,162  65,181 159,137 212,116 337,86
215,136 153,137 390,104 100,180  76,188  77,181  69,195  92,186
275,96  250,147  34,174 213,134 186,129 189,154 361,82  363,89
Note that the first part of the challenge required one element per row in the file, but the example is shown with multiple elements per row here. I'll support both, as it is quite easy 8and does not harm us - until we add the text type).
File: mksvg3
#! /usr/bin/env raku

unit sub MAIN ($file where $file.IO.f && $file.IO.r, :l(:$lsm));  # [1]

my @lines;
my @points;
my $height = 0;
my $width  = 0;

for $file.IO.lines.words -> $element
{
  my (@elems) = $element.split(",");

  if (@elems.elems == 4)
  {
    @lines.push: @elems;

    $height = max($height, @elems[1], @elems[3].Numeric);
    $width  = max($width,  @elems[0], @elems[2].Numeric);
  }
  elsif (@elems.elems == 2)
  {
    @points.push: @elems;

    $height = max($height, @elems[1].Numeric);
    $width  = max($width,  @elems[0].Numeric);
  }
  else
  {
    die "Wrong number of values; use 2 or 4 only";
  }
}

if $lsm                                                              # [1a]
{
  die "'Line of Best Fit' cannot be used with a dataset with lines"  # [1b]
    if @lines.elems;

  my $x  = 0;
  my $y  = 0;
  my $xx = 0;
  my $xy = 0;

  my $N = @points.elems;

  my $min-x = Inf;
  my $max-x = 0;

  for @points -> @point
  {
    my ($X, $Y) = @point;

    $min-x = min($min-x, $X.Numeric);
    $max-x = max($max-x, $X.Numeric);

    $x  += $X;
    $y  += $Y;
    $xx += $X ** 2;
    $xy += $X * $Y;
  }

  my $m = ($N * $xy - $x * $y) / ($N * $xx - $x ** 2);
  my $b = ($y - $m * $x) / $N;

  @lines.push(($min-x, ($m * $min-x) + $b, $max-x, ($m * $max-x) + $b));
}

say '<?xml version="1.0" encoding="UTF-8" standalone="yes"?>
<!DOCTYPE svg PUBLIC "-//W3C//DTD SVG 1.0//EN"
  "http://www.w3.org/TR/2001/REC-SVG-20010904/DTD/svg10.dtd">
  <svg height="' ~ $height ~ '" width="' ~ $width ~ '"
  xmlns="http://www.w3.org/2000/svg" xmlns:svg="http://www.w3.org/2000/svg"
  xmlns:xlink="http://www.w3.org/1999/xlink">';

if @points
{
  say '<g fill="#f73" id="points">';

  for @points -> @point
  {
    say ' <circle cx="' ~ @point[0] ~ '" cy="' ~ @point[1] ~ '" r="3" />';
  }

  say '</g>';
}

if @lines
{
  say '<g id="lines" stroke="#369" stroke-width="4">';

  for @lines -> @line
  {
    say ' <line x1="' ~ @line[0] ~ '" x2="' ~ @line[2]
              ~ '" y1="' ~ @line[1] ~ '" y2="' ~ @line[3] ~ '" />'
  }

  say '</g>';
}

say '</svg>';
[1] Use the «-lsm» command line option to get the lsm lin. Note that this option© will cause the program to terminate if you have added lines to the illustration yourself [1b]. The calculation is straight out of the webpage, so should require no explanation.
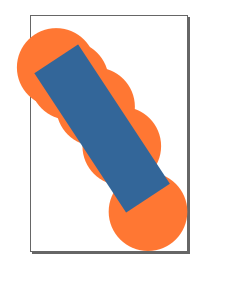
Note that I have changed the order; this time the line(s) are printed after the dots, as it is more important than the dots - in «lsm» mode. The downside is that the illustration from the first challenge will look silly now:
Let us try the example given on the webpage linked to in the challenge (to see that we got it right):
File: example-lsm.txt
2,4
3,5
5,7
7,10
9,15
The result does not look very nice. The line width and circle radius are excessive for such a small illustration.
We do need a way of changing them - and I will do so, in the upcoming bonus section.
Note that the illustration is mirrored compared to the one on the webpage. That is a result of messing with the axis. In geometry we have a point zero in the middle, and the values increase to the right (x) and upwards (y). SVG has the point zero in the upper left corner, and the y-axis has increasing values downwards.
I'll fix this, in the bonus section. On to the the actual task in hand:
First the points only:
$ ./mksvg3 example2.txt > example2a.svg
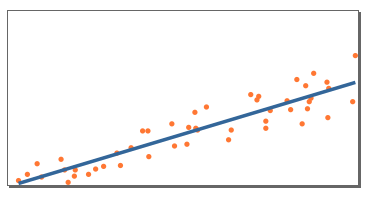
Then with the «lsm» line as well:
$ ./mksvg3 --lsm example2.txt > example2.svg
Bonus: A Scriptable SVG Generator
.. and it is backwards compatible with this week challenge input format. For both parts.I'll show the result this time, and present the finished program at the very end.
The <g> tag (grouping) is the cause of the ordering problem, as we paint all the circles before the lines or vice versa. We can get rid of them, and paint the individual circles and lines in the same order that we found them in the file.
I have chosen to use national flags as examples, as they are interesting geometric shapes.
Let us start with the Japanese flag (and Inkscape has chosen to only show part of the bounding box here):

The white portion of the flag (which really requires a visible bounding box to stand out) requires a new type, a rectangle. A rectangle is specified by the top left corner and the width and height. We must also add a way of specifying the fill colour.
We already support circles, so must add a way of specifying the fill colour and the size (radius).
File: japan.txt
:fc:#FFFFFF r,0,0,30,20
:cr:6 :cc:#bc002d 15,10
The first row has two components. The first (:fc:#FFFFFF) is the fill colour
specification. This color is used for future rectangles (and polygons, which we will
introduce later), until we change it. The second part is a rectangle (r,0,0,30,20)
where the initial «r» gives us the rectangle type. This is followed by the top left position
(x and y coordinate) and the width and height.
The second row has three components. The first (:cr:6) is the circle radius,
which is set to 6. (The default value is 3). The second (:cc:#bc002d) sets
the circle colour. (The default value is «#FF7733».) The third is the position of the
circle (the origo, or centre). Just two values, and we get a circle - so that we are
compatible with the challenge input format.
The Ukrainian flag has two rectangles:

:fc:#0057b7 r,0,0,3,1
:fc:#ffd700 r,0,1,3,1
The Norwegian flag is slightly more complicated:
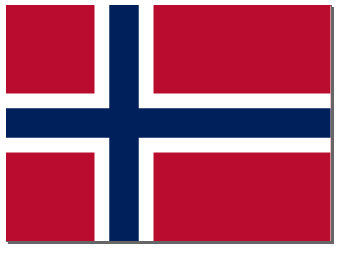
:fc:#BA0C2F r,0,0,22,16
:fc:#ffffff r,6,0,4,16 r,0,6,22,4
:fc:#00205B r,7,0,2,16 r,0,7,22,2
First the whole area in red. Then we add the white row and column on top of that, and finally we add the blue row and column on top of that again.
The American flag, with the stars added as text:

:fc:#B31942 r,0,0,250,10  r,0,20,250,10  r,0,40,250,10 r,0,60,250,10
            r,0,80,250,10 r,0,100,250,10 r,0,120,250,10
:fc:#FFFFFF r,0,10,250,10 r,0,30,250,10  r,0,50,250,10 r,0,70,250,10
            r,0,90,250,10 r,0,110,250,10
:fc:#0A3161 r,0,0,100,70
:tc:#FFFFFF :th:15 :ls:5pt
t,3,18,******
t,11,27,*****
t,3,36,******
t,11,46,*****
t,3,55,******
t,11,64,*****
t,3,73,******
This requires a text type: t,11,64,*****. The initial «t» gives us the text type.
It is followed by the position of the text (lower left corner of the text line; the baseline).
The last argument is the actual text. Note that it does not support spaces!
We control the text with the :tc: (text colour) and :th: (text height)
tags. The spacing between the characters is set with :ls: (letter spacing). It is
quite useful here, but probably not with normal text.
Real stars would have been nicer (and more authentic), and Unicode indeed has a star symbol that we can use. The text parameters require some tweaking (and I still haven't got it quite right):

:fc:#B31942 r,0,0,250,10  r,0,20,250,10  r,0,40,250,10 r,0,60,250,10
            r,0,80,250,10 r,0,100,250,10 r,0,120,250,10
:fc:#FFFFFF r,0,10,250,10 r,0,30,250,10  r,0,50,250,10 r,0,70,250,10
            r,0,90,250,10 r,0,110,250,10
:fc:#0A3161 r,0,0,100,70
:tc:#FFFFFF :th:9 :ls:4pt
t,3,12,★★★★★★
t,11,21,★★★★★
t,3,30,★★★★★★
t,11,39,★★★★★
t,3,48,★★★★★★
t,11,57,★★★★★
t,3,66,★★★★★★
The Czech Republic requires a new Polygon type. This is a multiple point structure that can be used to design arbitrary figures, which will fill in the area inside the (invisible) lines between the points (inlucding the missing line between the last and first point):

:fc:#FFFFFF r,0,0,6,2
:fc:#d7141a r,0,2,6,2
:fc:#11457e p,0,0,3,2,0,4
The last line sets up the polygon, with initial «p» to set the type. Specify an even number of values for the points - as many as you want.
The Union Jack is simplified by setting the bounding box manually, and painting outside it:

:w:60 :h:30

:fc:#012169 r,0,0,60,30

:lw:6 :lc:#ffffff 0,0,60,30      0,30,60,0
:lw:2 :lc:#C8102E -1.5,0,30,16   32.5,16,61.5,30
                  -1,31,29.5,16  30.5,14,61,-1

:fc:#ffffff r,0,10,60,10  r,25,0,10,30
:fc:#C8102E r,0,12,60,6   r,27,0,6,30
The first line sets an explicit width (:w:) and height (:h:)
of the illustration, so that we can get rid of the parts of the red lines that are outside
of the flag proper.
The resulting svg image, in some different sizes:

Note that the bounding box shown in the screenshots from Inkscape are missing, as the should.
I haven't gotten the diagonal red crosses quite right, though.
The full program, without any exdplanation:
File: mksvg-turbo
#! /usr/bin/env raku

unit sub MAIN ($file where $file.IO.f && $file.IO.r, :l(:$lsm));

my $height           = 0;
my $width            = 0;
my $padding          = 0;
my $line-width       = 4;
my $line-colour      = "#336699";
my $circle-radius    = 3;
my $circle-colour    = "#FF7733";
my $fill-colour      = "#000000";
my $text-height      = 8;
my $text-font        = "sans-serif";
my $text-colour      = "#ffffff";
my $letter-spacing   = 'normal';
my $fixed-height     = False;
my $fixed-width      = False;
my @svg;
my @points;

for $file.IO.lines.words -> $element
{
  my (@elems) = $element.split(",");

  if (@elems.elems == 1)
  {
    if    @elems[0] ~~ /^\:h\:(\d+)$/
    {
      $height = $0.Numeric; $fixed-height = True;
    }
    elsif @elems[0] ~~ /^\:w\:(\d+)$/
    {
      $width = $0.Numeric;  $fixed-width = True;
    }
    elsif @elems[0] ~~ /^\:p\:(\d+)$/
    {
      $padding = $0.Numeric;
    }
    elsif @elems[0] ~~ /^\:cr\:(\d+)$/
    {
      $circle-radius = $0.Numeric;
    }
    elsif @elems[0] ~~ /^\:lw\:(\d+)$/
    {
      $line-width = $0.Numeric;
    }
    elsif @elems[0] ~~ /^\:lc\:(\#......)$/
    {
      $line-colour = $0.Str;
    }
    elsif @elems[0] ~~ /^\:fc\:(\#......)$/
    {
      $fill-colour = $0.Str;
    }
    elsif @elems[0] ~~ /^\:cc\:(\#......)$/
    {
      $circle-colour = $0.Str;
    }
    elsif @elems[0] ~~ /^\:tc\:(\#......)$/
    {
      $text-colour = $0.Str;
    }
    elsif @elems[0] ~~ /^\:tf\:(.+)$/
    {
      $text-font = $0.Str;
    }
    elsif @elems[0] ~~ /^\:th\:(\d+)$/
    {
      $text-height = $0.Numeric;
    }
    elsif @elems[0] ~~ /^\:ls\:(.+)$/
    {
      $letter-spacing = $0.Str;
    }
    else {
      die "Illegal: @elems[0]";
    }
   }

  elsif (@elems.elems == 2)
  {
    @svg.push: '<circle cx="' ~ @elems[0] ~ '" cy="' ~ @elems[1]
      ~ '" r="' ~ $circle-radius ~ '" fill="' ~ $circle-colour ~ '"/>';

    @points.push: @elems if $lsm;

    $height = max($height, @elems[1].Numeric) unless $fixed-height;
    $width  = max($width,  @elems[0].Numeric) unless $fixed-width;
  }
  elsif (@elems[0] eq "p")
  {
    my $svg = '<polygon points="';

    my @points = @elems[1 .. Inf];
    while (@points.elems >= 2)
    {
      $svg ~= @points.shift ~ "," ~ @points.shift ~ " ";
    }
    $svg ~= '" style="fill: ' ~  $fill-colour ~ ';"/>';
    @svg.push: $svg;
  }
  elsif (@elems.elems == 4 && @elems[0] eq "t")
  {
    @svg.push: '<text x="' ~ @elems[1] ~ '" y="' ~ @elems[2]
      ~ '" style="font-family: ' ~ $text-font ~ '; font-size: '
      ~ $text-height ~ 'pt; stroke: none; fill:' ~ $text-colour
      ~ '; letter-spacing: ' ~ $letter-spacing ~ ';">' ~ @elems[3]
      ~ '</text>';
  }
  elsif (@elems.elems == 4)
  {
    @svg.push: '<line x1="' ~ @elems[0] ~ '" x2="' ~ @elems[2]
      ~ '" y1="' ~ @elems[1] ~ '" y2="' ~ @elems[3] ~ '" stroke-width="'
      ~ $line-width ~ '" stroke="' ~ $line-colour ~ '"/>';

    $height = max($height, @elems[1], @elems[3].Numeric) unless $fixed-height;
    $width  = max($width,  @elems[0], @elems[2].Numeric) unless $fixed-width;
  }
  elsif (@elems.elems == 5 && @elems[0] eq "r")
  {
    @svg.push: '<rect x="' ~ @elems[1] ~ '" y="' ~ @elems[2] ~ '" width="'
      ~ @elems[3] ~ '" height="' ~ @elems[4] ~ '" fill="' ~ $fill-colour
      ~ '"/>';

    $height = max($height, @elems[2] + @elems[4]) unless $fixed-height;
    $width  = max($width,  @elems[1] + @elems[3]) unless $fixed-width;
  }

  else
  {
    die "Wrong number of values; use 2 or 4 only";
  }
}

if $lsm
{
  my $x  = 0;
  my $y  = 0;
  my $xx = 0;
  my $xy = 0;

  my $N = @points.elems;

  my $min-x = Inf;
  my $max-x = 0;

  for @points -> @point
  {
    my ($X, $Y) = @point;

    $min-x = min($min-x, $X.Numeric);
    $max-x = max($max-x, $X.Numeric);

    $x  += $X;
    $y  += $Y;
    $xx += $X ** 2;
    $xy += $X * $Y;
  }

  my $m = ($N * $xy - $x * $y) / ($N * $xx - $x ** 2);
  my $b = ($y - $m * $x) / $N;

  @svg.push: ' <line x1="' ~ $min-x ~ '" y1="' ~ ($m * $min-x) + $b
    ~ '" x2="' ~ $max-x ~ '" y2="' ~ ($m * $max-x) + $b
    ~ '" stroke-width="' ~ $line-width  ~ '" stroke="' ~ $line-colour
    ~ '"/>';
}


say '<?xml version="1.0" encoding="UTF-8" standalone="yes"?>
<!DOCTYPE svg PUBLIC "-//W3C//DTD SVG 1.0//EN"
  "http://www.w3.org/TR/2001/REC-SVG-20010904/DTD/svg10.dtd">
  <svg height="' ~ $height + $padding ~ '" width="' ~ $width + $padding~ '"
  xmlns="http://www.w3.org/2000/svg" xmlns:svg="http://www.w3.org/2000/svg"
  xmlns:xlink="http://www.w3.org/1999/xlink">';

say @svg.join("\n");
say '</svg>';
And that's it.